Investigation of regional climate change signals
Temperature variability changes in simulated time series of the 21st century in Germany
Katharina Bülow, Holger Göttel, Daniela Jacob
The first signals of climate change in Germany were observed in the increase of the mean temperature since the end of the 20th century [Fricke, 2003]. Recent hot spells like the summer 2003 in Europe, as well as the evidence of a warming trend in mean temperature due to greenhouse gas induced climate change, ask for an urgent examination of the possible changes in temperature in the 21st century. The summer 2003 was extremely hot, an outlier that did not fit into the temperature distribution of long temperature observations in Germany [Schoenwiese et al., 2004]. Will the summer 2003 be “a shape of things to come” [Beniston, 2004] at the end of the 21st century?
Figure 1: Orography of central Europe with 10 x 10 km horizontal resolution
Substantial interest has emerged in the probability of the occurrence of extreme events. Therefore we have used monthly mean temperature time series from the period of 1950 until 2100 to determine possible changes in mean climate and climate variability in central Europe (see the orography in Figure 1). The times eries were generated with help of the three dimensional hydrostatic regional climate model REMO [Jacob, 2001; Semmler, 2002; Jacob et al., 2007]. The Special Report on Emission scenarios (SRES) A1b, B1, A2 of the Intergovernmental Panel on Climate Change (IPCC) are used to prescribe the concentrations of greenhouse gases in the model atmosphere [Houghton et al., 2001].
A generalized time series decomposition technique is used, which shows that the temperature time series can be described by a realization of a Gauss distributed random variable with time dependent mean and variance. These two parameters are linear combinations of a constant, four trend functions, three functions describing the annual cycle and three functions describing the seasonal cycle. Changes in amplitude and phase of the annual and seasonal cycles can be taken into account by the model, as well as a linear and quadratic dependence on time. Superposition of several functions allows for the detection of linear, progressively and degressively shaped changes in the times series [Trömel, 2005; Trömel et al., 2007]. This technique makes it possible to determine the probability density function for each time step of the temperature series.
The most striking results, which are found analysing the monthly temperature time series, are different trends in the mean for each scenario. The trend of the mean value increases quadratically with time. It exceeds 0.5 K in 2000 and reaches different values in 2099 for each SRES scenario, for example 4.8 K (A1B), 3.0 K (B1), 4.5 K (A2) at the station Karlsruhe (Figure 2).
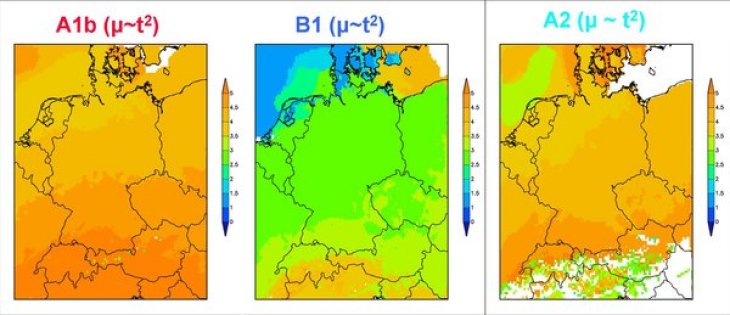
Figure 2: Coefficient of the trend function for the monthly temperature mean value, which increases proportional ~t2 as a result of the time series decomposition of the REMO temperature series by using different SRES scenarios A1b, B1, A2.
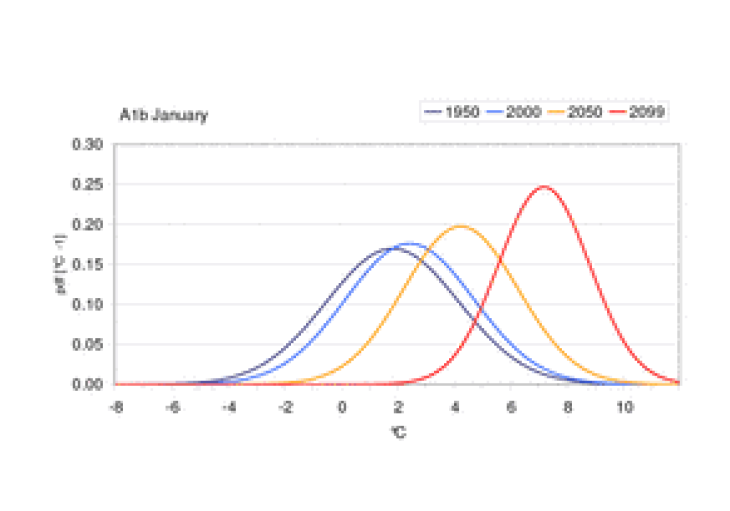
Figure 3: Probability density function of the monthly mean January (left) and July (right) temperature for the years 1950, 2000, 2050, 2100 at station Karlsruhe obtained by using SRES Szenario A1b.
The standard deviation decreases in winter and increases in summer only in the southern part of Germany for scenario A1b. The probability of very high temperatures in summer increases at the end of the 21st century in scenario A1b (Figure 3).
References:
- Beniston, M (2004) The 2003 heat wave in Europe: A shape of things to come? An analysis based on Swiss climatological data and model simulations. Geophys Res Lett 31: L02202, doi:10.1029/2003GL018857
- Fricke, W (2003) Der Sommer 2003 in der 222-jährigen Meßreihe aus Hohenpeißenberg. Global Atmosphere Watch Brief 18, Deutscher Wetterdienst, Offenbach
- Houghton JT, Ding Y, Griggs DJ, Noquer M, van der Linden PJ, Dai X, Maskell K, Johnson CA (eds) (2001) Contribution of Working Group I to the Third Assessment Report of the Intergovernmental Panel on Climate Change. Cambridge University Press, Cambridge, United Kingdom and New York, NY, USA, pp 881
- Jacob D (2001) A note to the simulation of the annual and inter-annual variability of the water budget over the Baltic Sea drainage basin. Meteorol Atmos Phys 77: 61-73, doi: 10.1007/s007030170017
- Jacob D, Bäring L, Christensen OB, Christensen JH, de Castro M, Déqué M, Giorgi F, Hagemann S, Hirschi M, Jones R, Kjellström E, Lenderink G, Rockel B, Schär Ch, Seneviratne SI, Somot S, van Ulden A, van den Hurk B (2007) An inter-comparison of regional climate models for Europe: model performance in present day climate. Clim Change 81: 31-52, doi: 10.1007/s10584-006-9213-4
- Schönwiese CD, Staeger T, Trömel, S (2004) The hot summer 2003 in Germany. Some preliminary results of a statistical time series analysis. Meteorologische Zeitschrift 13: 323-327
- Semmler T (2002) Der Wasser- und Energiehaushalt der arktischen Atmosphäre. PhD thesis, Max Planck Institut für Meteorologie, Hamburg, Germany
- Trömel S (2005) Statistische Modellierung von Klimazeitreihen. PhD thesis, Bericht Nr. 2, Institut für Atmosphäre und Umwelt, J.W. Goethe Universität, Frankfurt am Main
- Trömel S, Schönwiese CD (2007) Probability change of extreme precipitation observed from 1901 to 2000 in Germany. Theor Appl Climatol 87: 29-39, doi: 10.1007/s00704-005-0230-4