Vegetation parameterization in REMO
Vegetation parameterization in REMO
Diana Rechid
The land surface processes in the regional climate model REMO are controlled by the physiological vegetation properties surface albedo, fractional vegetation cover, leaf area index (LAI), forest ratio, roughness length and water holding capacity. The background surface albedo is the albedo over snow-free land areas. Over snow and sea, surface albedo is modified by surface conditions during the model simulation. It determines the short-wave radiation budget at the earth surface. The fractional vegetation cover is assigned to each surface grid box as fraction of photosynthetically active vegetation. It determines the fraction of grid area where vegetation properties take effect on surface exchange processes. The LAI as the ratio of one-sided leaf area to ground area affects the interception and the evapotranspiration through stomatal conductance. The surface roughness length due to vegetation and orography determines the drag coefficients for momentum and heat and the water holding capacity determines the soil water content.
The vegetation parameter values are extracted from a global dataset of land surface parameters (Hagemann et al. 1999, Hagemann 2002). These global data fields are based on the distribution of major ecosystem types according to the definitions given by Olson (1994a, 1994b). This global dataset of land use classes was derived from Advanced Very High Resolution Radiometer AVHRR data at 1 km resolution supplied by the International Geosphere-Biosphere Program (Eidenshink and Faundeen 1994) and constructed by the U.S. Geological Survey (1997, 2002). For each land use class mean parameter values for the vegetation properties are allocated. The global datafields are adapted to the regional model domains and used as lower boundary condition for the model simulations. The annual vegetation cycle is characterised by monthly values of fractional vegetation cover, LAI and background surface albedo (LSPII dataset). They are estimated by a global data field of the monthly growth factor, which determines the growth characteristics of the vegetation at a horizontal resolution of 0.5 degree (Hagemann 2002). As example, the minimum and maximum LAI values for a 0.5 degree REMO model domain is shown in figure 1.
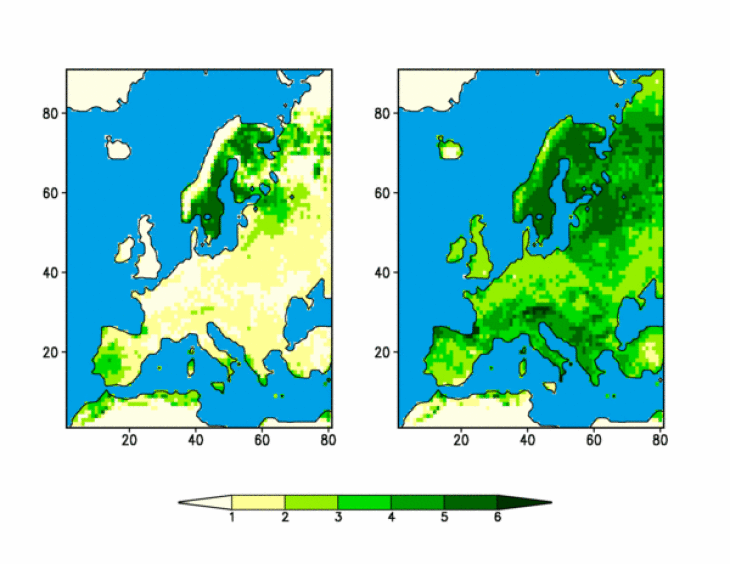
Minimum LAI of the dormancy season (left panel) and maximum LAI of the growing season (right panel) for a 0.5 degree REMO model domain
The impact of the annual vegetation cycle on the simulated regional climate
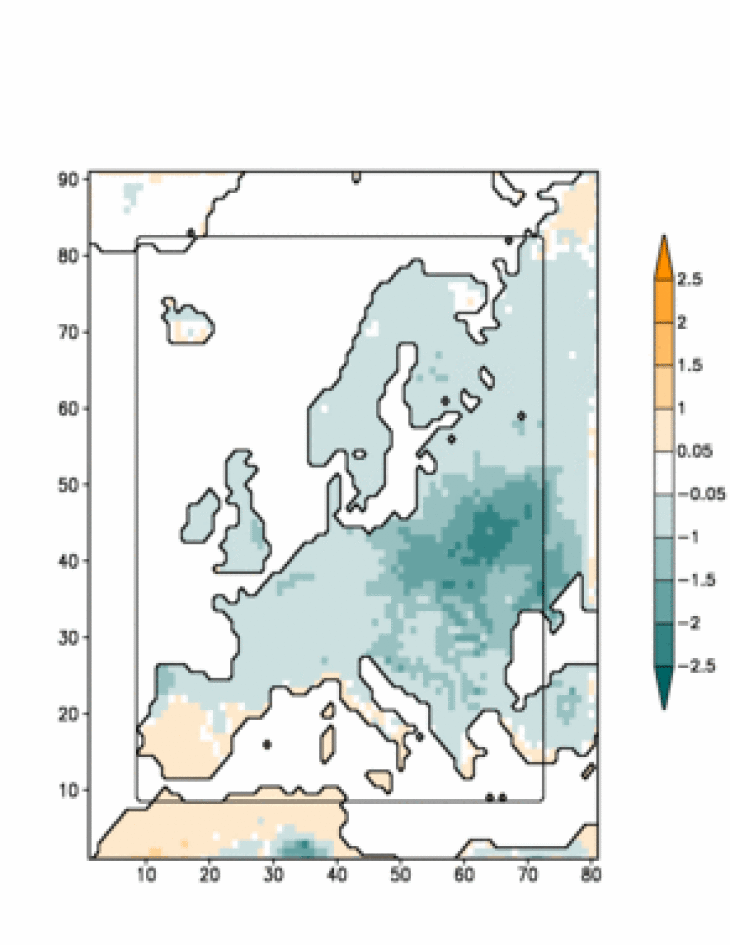
Fig. 2a: Seasonal mean JJA 1979-1993 of the change in surface temperature [K] caused by the annual vegetation cycle (compared to control run with constant vegetation).
The annual cycle of vegetation is implemented in the REMO model and its impact on the simulated regional climate was investigated (Rechid & Jacob 2006). It strongly affects the water and energy fluxes at the land surface. The raised LAI values and fractional vegetation cover during the growing season directly increase evapotranspiration and therefore latent heat flux, whereas sensible heat flux is decreased. These changes lead to lower surface temperatures and increased precipitation (Figure 2).
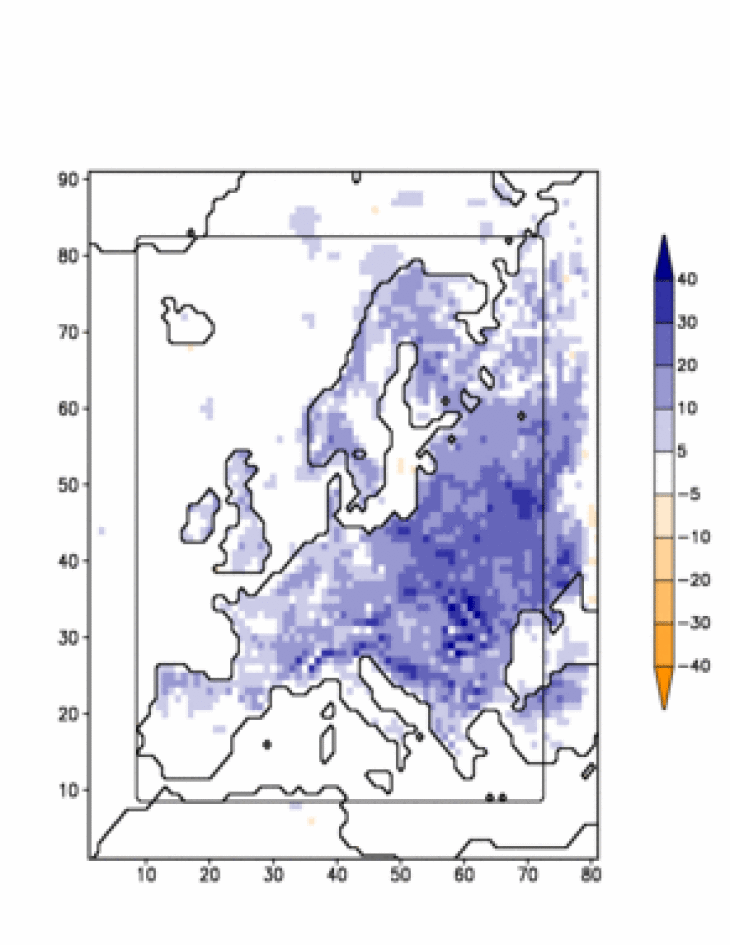
Fig. 2b: Seasonal mean JJA 1979-1993 of the change in precipitation caused by the annual vegetation cycle (compared to control run with constant vegetation).
The temporal analysis of the results reveals that the vegetation effect on the simulated climate occurs mainly in the summer season. In general, the simulated near-surface climate becomes cooler and wetter during the growing season. Concerning the spatial resolution, main effects can be detected in eastern Europe and the Hungarian lowlands. In these regions the more realistic vegetation treatment improves the simulated mean annual cycles of 2m temperature and precipitation with respect to the observations.
The annual surface albdo cycle as a function of vegetation phenology
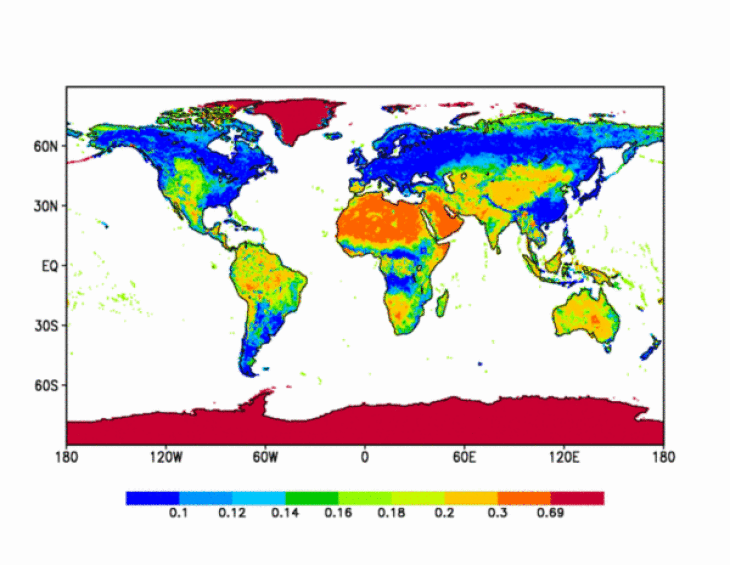
Fig. 3: Soil albedo on the global 0.5 degree regular longitude/latitude grid.
To estimate the annual albedo cycle over snow free land surfaces as a function of vegetation phenology remotely sensed data from MODIS/Terra (USGS 2005) is analysed. The optical contrast between the vegetation canopy and the underlying surface determines how vegetation phenology effects land surface albedo. To separate the vegetation albedo from the underlying soil albedo the white sky total shortwave broad band albedo and the fraction of absorbed photosynthetically active radiation (FPAR) deduced from MODIS measurements during 2001 to 2004 are analysed. Global maps of pure soil albedo (Figure 3) and pure vegetation albedo (Figure 4) are derived on a 0.5 degree regular latitude/longitude grid.
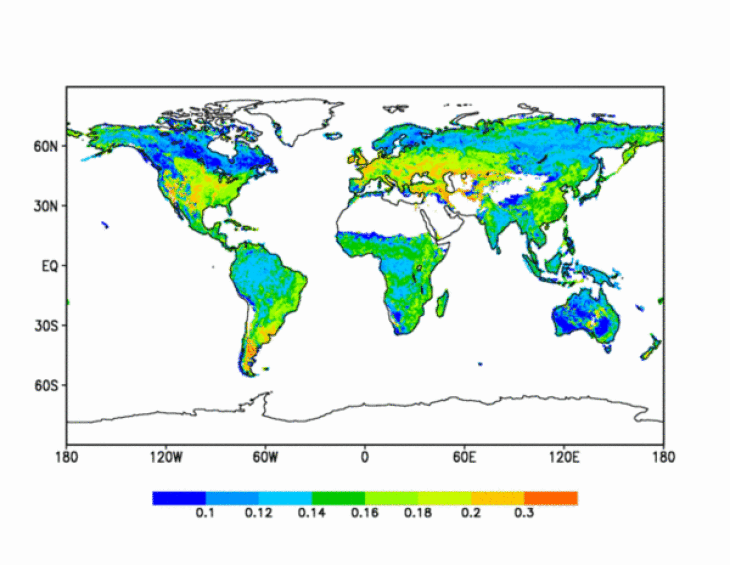
Fig. 4: Vegetation albedo on the global 0.5 degree regular longitude/latitude grid
They show that in the northern and mid-latitudes soils are mostly darker than vegetation, whereas in the lower latitudes, especially in semideserts, soil albedo is mostly higher than vegetation albedo. The separated soil and vegetation albedo are adapted to the regional climate model domains and the annual albedo cycle for REMO is computed from the models' monthly varying leaf area index (Rechid et al. 2008a, Rechid et al. 2008b).
Dynamic phenology in REMO
The dynamic phenology scheme PHENO was developed to consider the interannual variability of vegetation phenology due to climate variability and its feedback to the simulated climate (Rechid & Jacob 2008). It relates basic phenological phases, such as the start and the end of the vegetation growing season, directly to the simulated climate. The model is designed and tested especially for Europe, the standard model domain of the regional climate model REMO. The annual vegetation cycle with minimum vegetation cover during the dormancy season and maximum vegetation cover during the growing season is described as a function of near surface heat and moisture conditions simulated by the regional climate model (figure 5). Running 10-day means of daily surface temperature, soil wetness and precipitation are given to the phenology model PHENO once a day, which, in turn, computes daily values of leaf area index LAI, fractional green vegetation cover and background land surface albedo. These values are returned to the climate model once a day and can give a feedback to the near surface climate conditions.
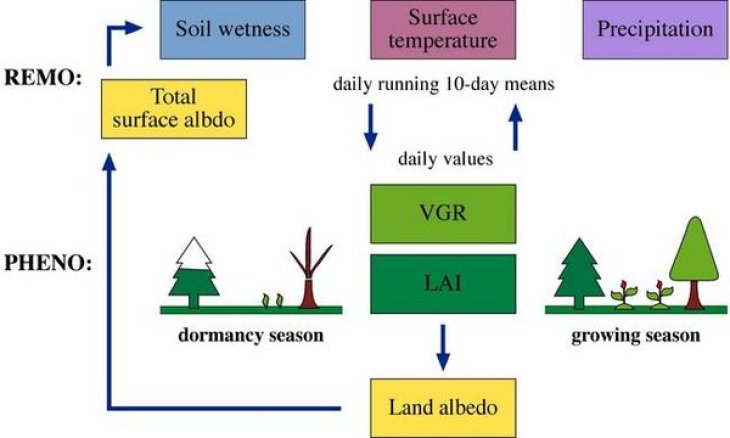
Fig.5 Dynamic coupling of the PHENO scheme and the regional climate model REMO
The phenology model PHENO represents the interannual variability and the temporal trends in vegetation phenology caused by climate variability. In Germany, the timing of the leaf expansion in spring is varying from year to year in dependence on the surface temperatures. The leaf senescence in fall is varying in subject to the surface temperatures and the soil moisture content. Especially in warm and dry years, the LAI decreases earlier in late summer/autumn due to water limiting conditions. The observed long-term trends in plant phenology, which have been investigated in many ecological studies, are captured by the PHENO simulations. The onset of spring phenology is 5.9 days earlier and the growing season becomes 4.1 days longer during the simulated period from 1958 to 2003 (Figure 6).
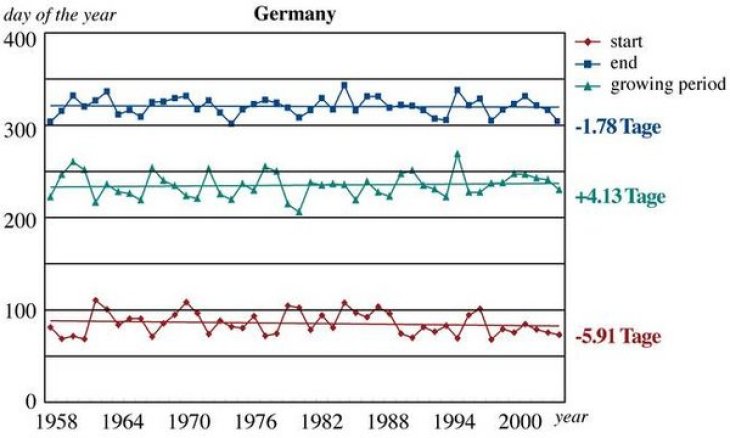
Fig.6: Dynamic coupling of the PHENO scheme and the regional climate model REMO
For today's climate, the feedback of the interannual variability of the plant phenology on the simulated climate as well as on the vegetation itself was investigated by the PHENO online simulation fully coupled to REMO. The evaluations for Germany show a positive feedback on drought conditions during warm and dry summer and autumn seasons by intensifying the effect of water limitation in the coupled model simulation, which leads to another decrease in LAI. The use of the PHENO scheme facilitates an improved representation of vegetation in REMO, that may become especially important in future climate change simulations.
References:
- Eidenshink, J.C., J.L. Faundeen, 1994: The 1 km AVHRR global land data set: First stages in implementation, International Journal of Remote Sensing, 15, 3443-3462
- Hagemann, S., M. Botzet, L. Dümenil, B. Machenhauer, 1999: Derivation of global GCM boundary conditions from 1 km land use satellite data. Report No. 289, Max-Planck-Institute for Meteorology, Hamburg
- Hagemann, S., 2002: An improved land surface parameter dataset for global and regional climate models. Max-Planck-Institute for Meteorology, Report 336, Hamburg
- Olson, J.S., 1994a: Global ecosystem framework-definitions. USGS EROS Data Centre Internal Report, Sioux Falls, SD
- Olson, J.S., 1994b: Global ecosystem framework-definitions. USGS EROS Data Centre Internal Report, Sioux Falls, SD
- Rechid, D., D. Jacob, 2006: Influence of monthly varying vegetation on the simulated climate in Europe. Meteorologische Zeitschrift, 15, 1, 99-116
- Rechid D, Raddatz TJ, Jacob D (2008a): Parameterization of snow-free land surface albedo as a function of vegetation phenology based on MODIS data and applied in climate modelling. Theor Appl Climatol, DOI 10.1007/s00704-008-0003-y
- Rechid D, Hagemann S, Jacob D (2008b): Sensitivity of climate models to seasonal variability of snow-free land surface albedo.Theor Appl Climatol, DOI 10.1007/s00704-007-0371-8
- Rechid D, Jacob D (2008): Dynamic interactions between plant phenology and climate variability simulated by the regional climate model REMO over Europe. Clim Dyn, submitted
- U.S. Geological Survey, 1997: Global land cover characteristics data base. edcdaac.usgs.gov/glcc/globedoc2_0.html
- U.S. Geological Survey, 2002: Global land cover characteristics data base version 2.0. edcdaac.usgs.gov/glcc/globedoc2_0.html
- U.S. Geological Survey, 2005: edcdaac.usgs.gov/modis/dataproducts.asp edcdaac.usgs.gov/modis/dataproducts.asp